The Benefits of Process Mapping - From the Bush to the Boardroom
As the expectations and regulations increase in the beef industry, we venture further from a ‘lifestyle’ and more toward a ‘business’. It has become integral for producers and their employees to work more efficiently toward their goal, with a distinct focus on the bottom line and the 1%’s. Communicating the common goal and the steps involved in achieving this, creates unity and encourages efficiency in the workplace.
‘Process Mapping’ is defined as a planning and management tool that visually describes the flow of work. By taking proactive steps to standardize and then effectively communicate processes, you can prepare your business to overcome challenges and manage uncertainty.
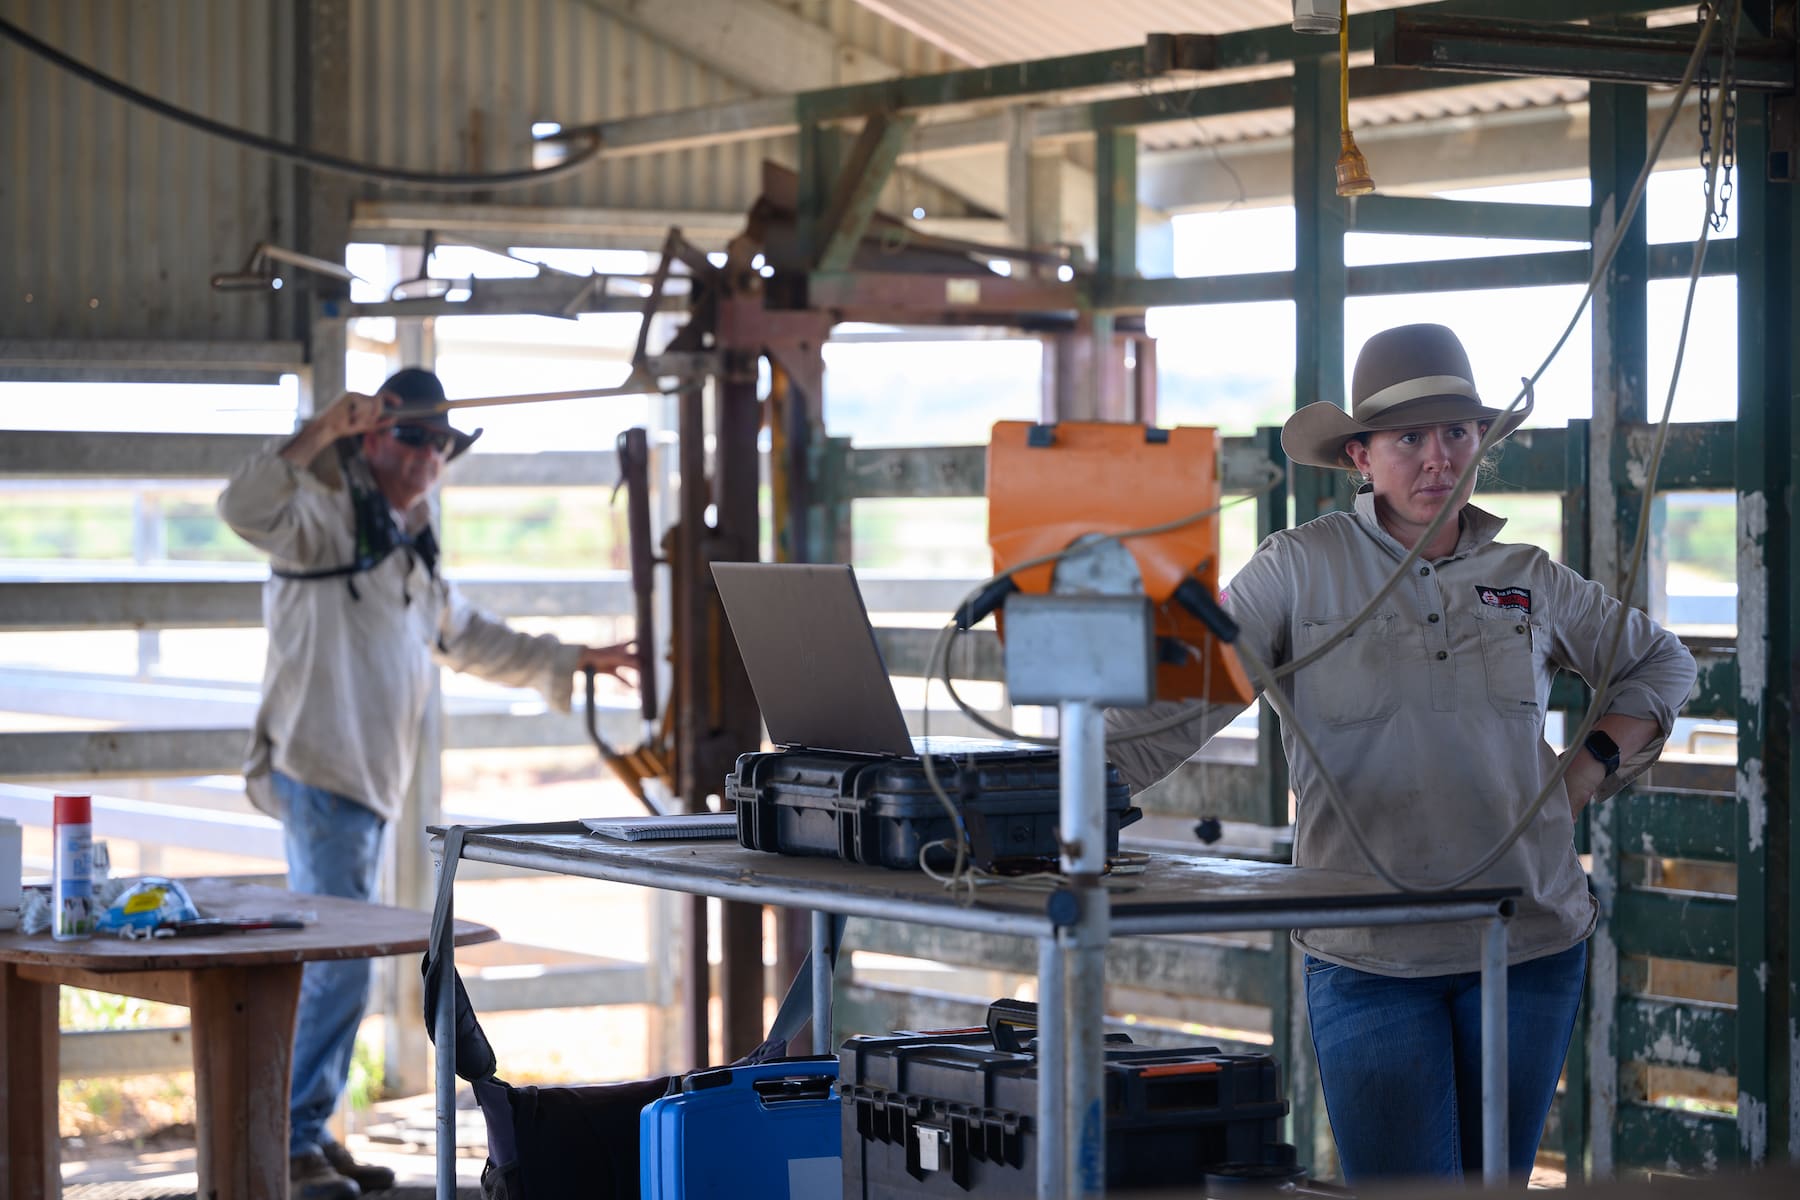
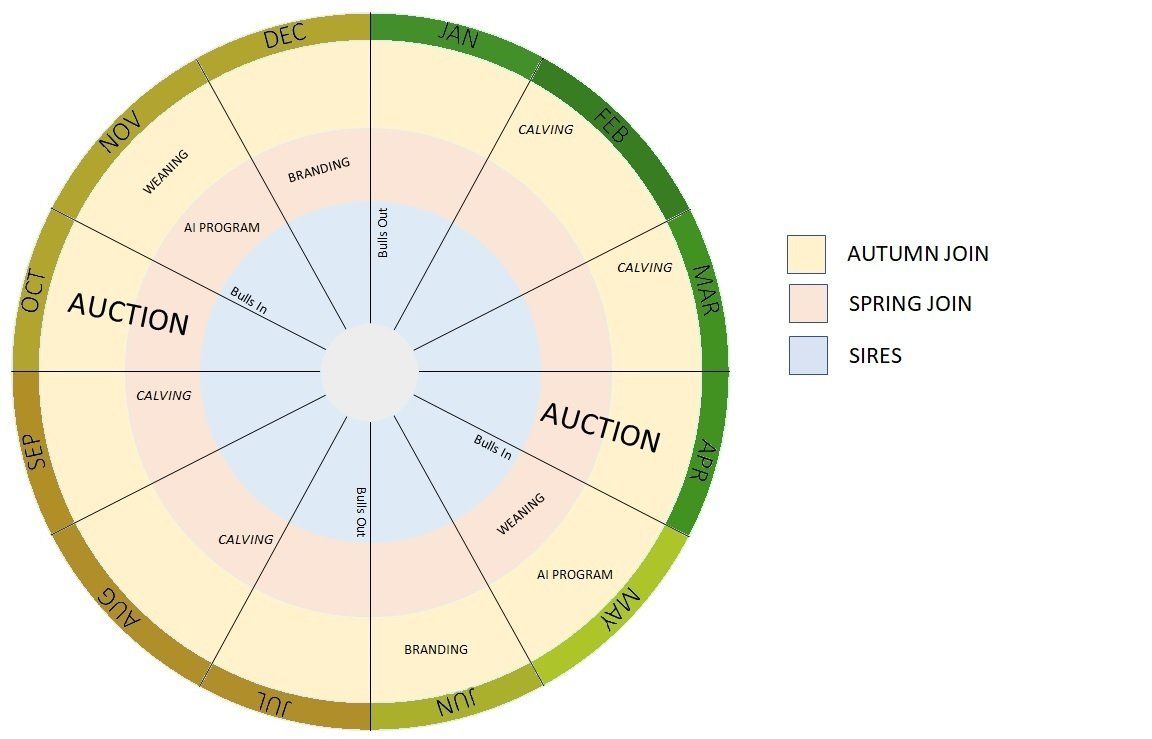
At Bar H, there are two 65-day joining periods, timing and planning is of the essence and we often find the need to introduce contractors to the team in order to achieve what is required during busy periods. To allow permanent staff members to accurately communicate the common goal, Bar H have relied upon a ‘Production Wheel’ for quite some time. The wheel is supported by our ‘Production Guide, providing intricate detail into each of the procedures, specifically for management personnel - the wheel is a visual concept of what is to be achieved in a calendar year.
In a report written by the University of Salford in Manchester about the functions of visual management, there were nine key functions of the visual communication method. These were;
- Transparency
- Discipline
- Continuous Improvement
- Job Facilitation
- On-the-Job Training
- Creating Shared Ownership
- Management by facts
- Simplification
- Unification
Discipline was defined as ‘making a habit of properly maintaining correct procedures” (Hirano, 1995). The article read that “anyone, even a newly hired, inexperienced employee, should be able to distinguish between normal and abnormal conditions at a glance and start taking the correct steps, developing a intuitive, habitual correctness, without being dependent on another entity” (#2, page 7).
IN 1953, the Ishikawa (Cause and effect or Fishbone) diagram was employed by Kaoru Ishikawa for the first time. He advocated that 95% of quality related problems can be resolved with seven basic visual tools; flowcharts, check sheets, Pareto diagrams, cause and effect diagrams, histograms, scatter diagrams, and control charts.
Using process mapping as a form of communication within the workplace cultivates a culture that encourages the entire team to be held responsible and accountable for their work This constitutes a supportive network and aids in reducing miscommunication or mistakes.
Whilst the thought of being replaceable in the workplace can be somewhat daunting, at Bar H we strive for the regular day to day operation to be as systematic and predictable as possible. By encouraging replaceability it allows the team to be innovative and challenge themselves at another level and standard. By making room in our team from a systematic approach, it provides us with the freedom to focus on the next step of the business.
“Try not to become a person of success, but rather try to become a person of value.”
Albert Einstein
Other Posts